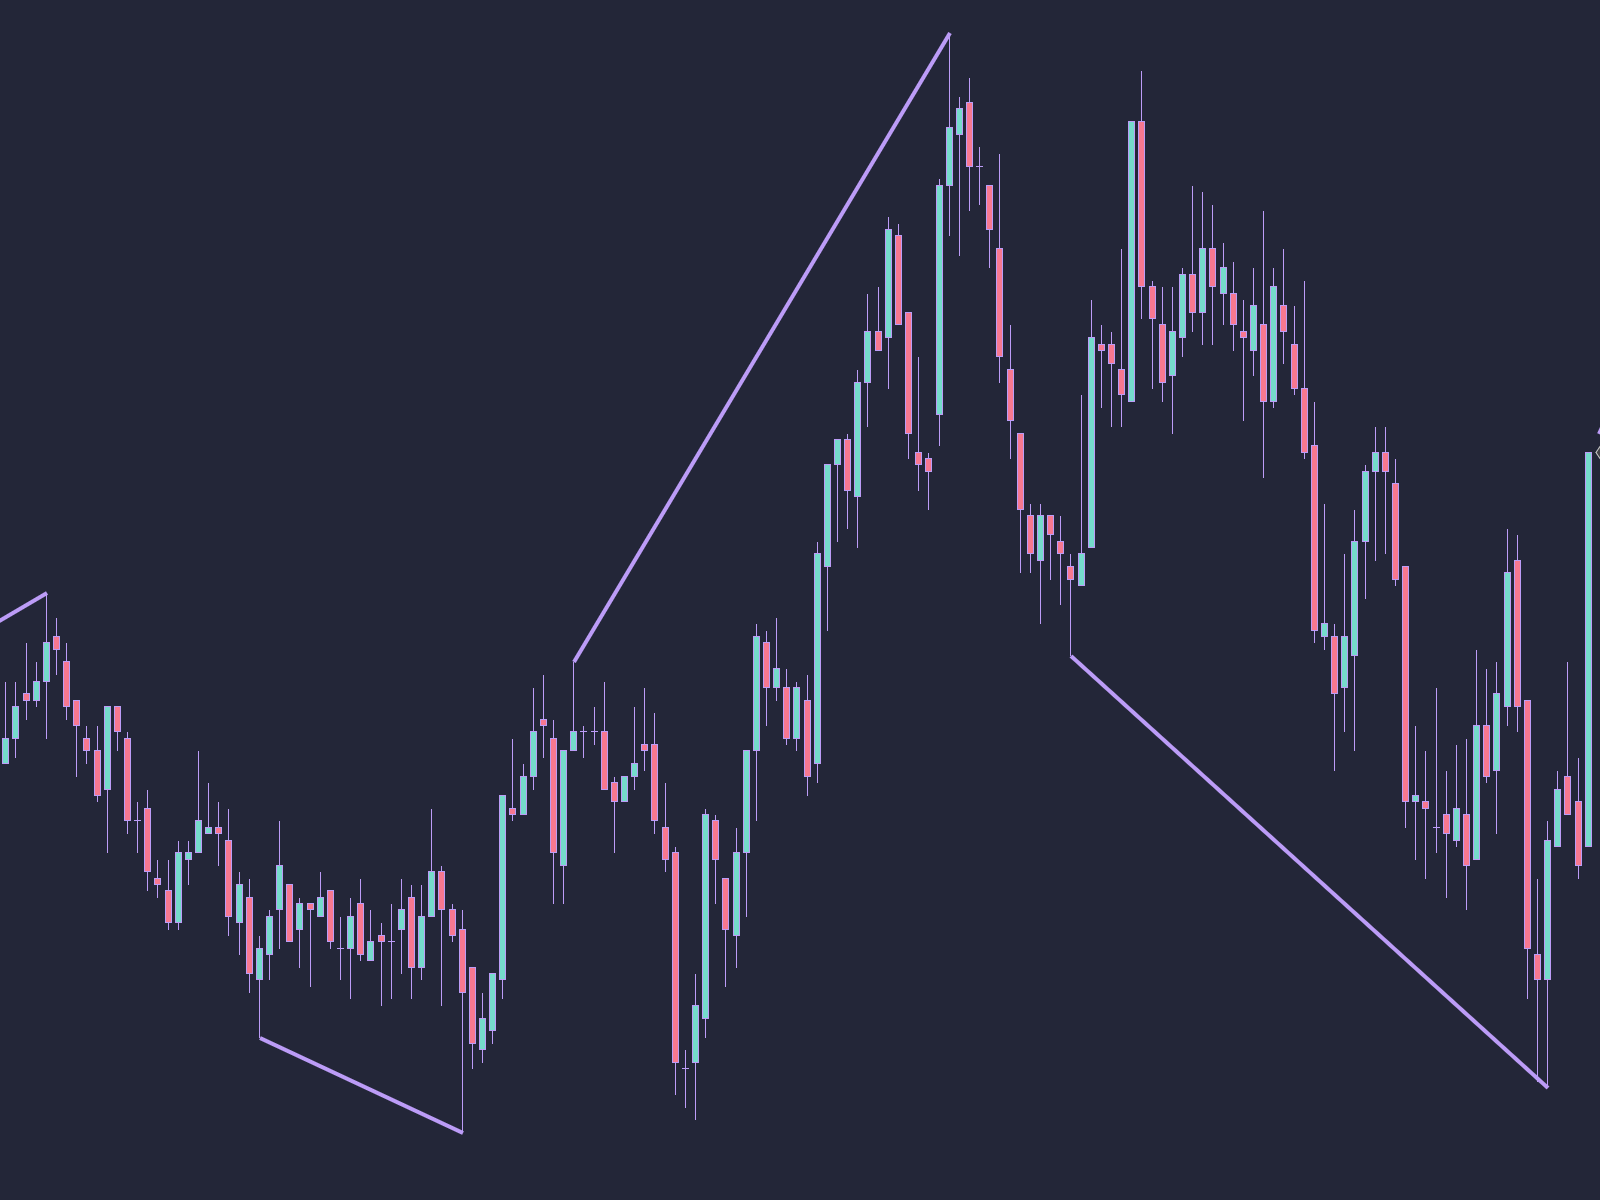
Broadening Formations
Expansion Pattern Detector
Sophisticated swing detection and break of structure analysis to identify expanding price patterns. Uses configurable swing periods and dynamic trend line drawing to visualize broadening formations as they develop.
Key Features
Break of Structure Detection
Automatically identifies when price breaks above swing highs or below swing lows, drawing trend lines from the swing point to the break.
Dynamic Line Extension
Lines automatically extend to new highs or lows when the same swing structure is broken further, maintaining pattern integrity.
Swing Point Analysis
Sophisticated algorithm identifies valid swing highs and lows using configurable period lookback on both sides.
Clean Chart Management
'Keep Only Recent' option removes previous BOS lines to maintain chart clarity and focus on current patterns.
Customizable Visualization
Full control over line colors, width, and style (solid, dashed, dotted) for both upper and lower formations.
Performance Optimized
Calculates on bar close for efficient performance with minimal impact on platform resources.
Configuration Settings
BF Size
Default: 10Swing Distance
Upper BF
Default: Medium PurpleColor for upper broadening formation lines
Lower BF
Default: Medium PurpleColor for lower broadening formation lines
Width
Default: 4Line width
Line Style
Default: SolidLine style (Solid, Dash, DashDot, DashDotDot, Dot)
Keep Only Recent
Default: FalseIf true, always delete the previous BOS line for each swing type before drawing a new one